At Technomics, complex problems are solved via credible and defensible analysis of data. Analytical rigor enables insight into cause-and-effect relationships underlying complex problems. Intellectual curiosity and data-driven analysis is so deeply woven into the fabric of this company and its employees that we often find ourselves creating unique problem solving opportunities. This has most recently been demonstrated by Technomics’ Technical Director and former CEO, Rick Collins, during his epic 3,700-mile cross-country cycling journey in this past summer.
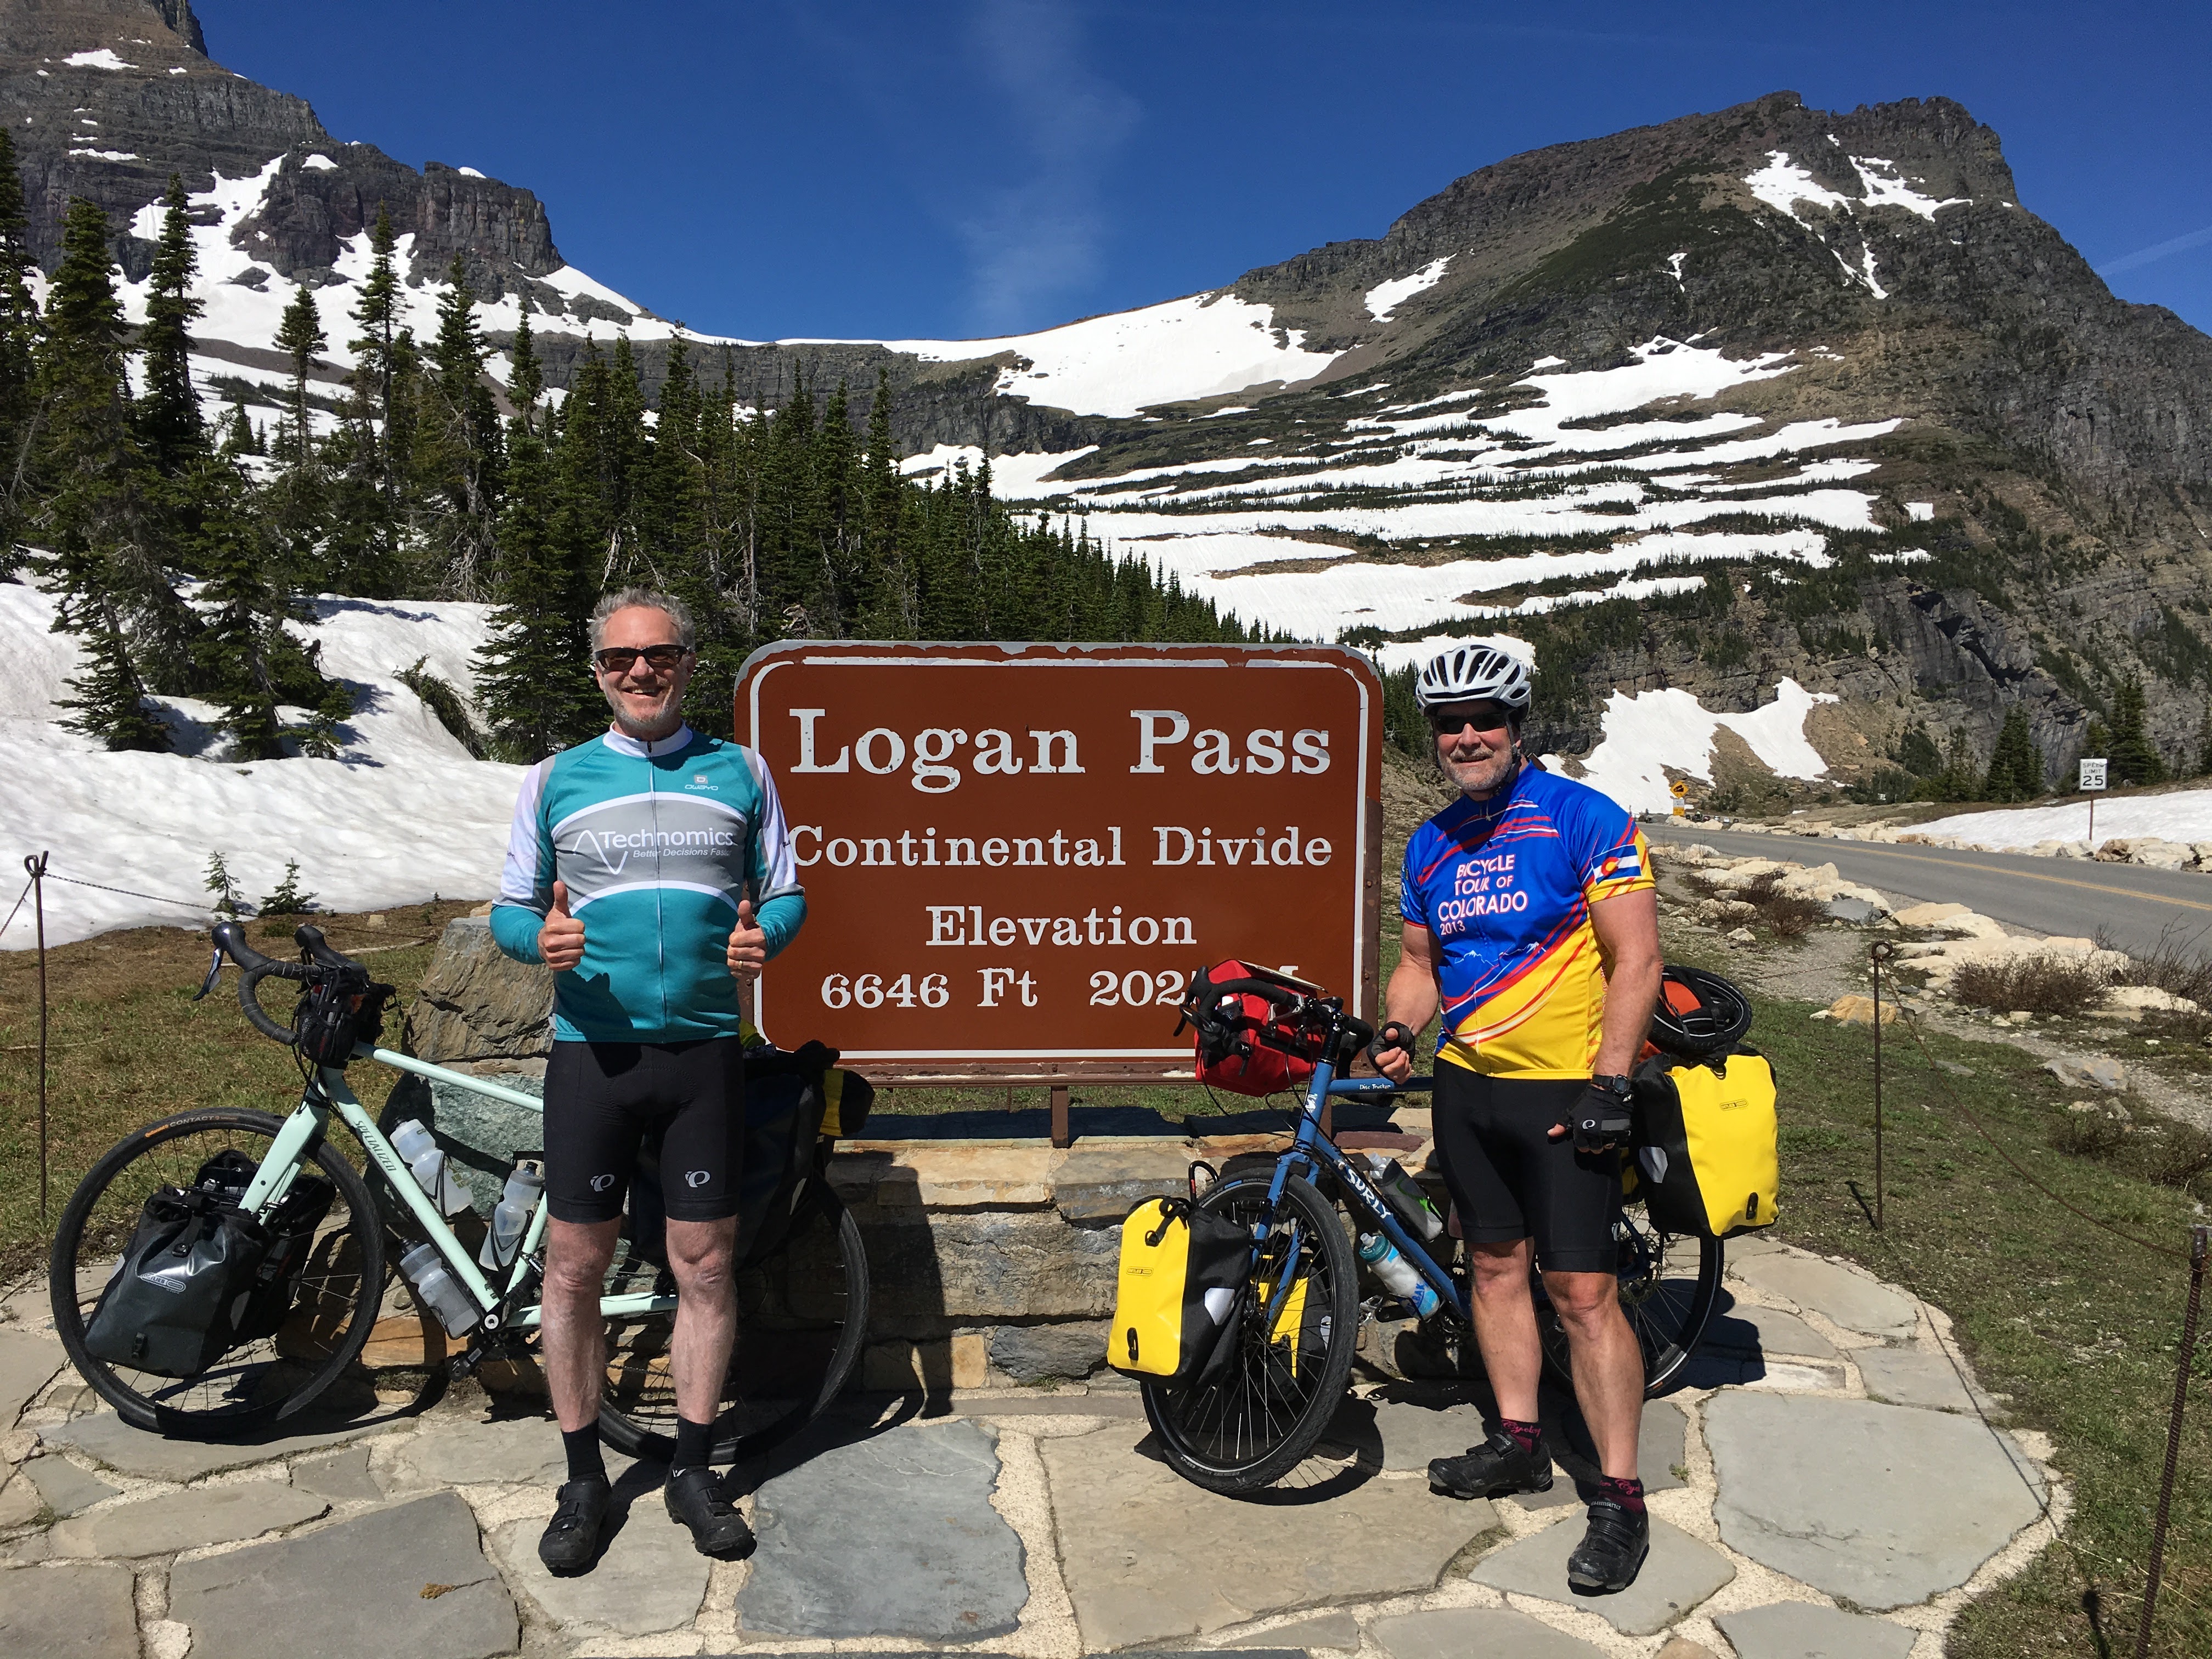
 Rick and his ‘BFF’, Hank Berg, had been dreaming of taking on such an adventure for some time, but, as Rick so eloquently puts it, “once the beer wore off and our wives finished reminding us that we’d lost our minds … we would settle for a less physically and time demanding cycling adventure.” Finally, after turning 60, they decided to take the plunge and ride the “Northern Tier” cross country route, which would take them across the Cascades, the Rockies, the Adirondacks, and the Green and White Mountains and through everything in-between. The trip covered 3,702 miles, required 68 days of riding at an average of nearly 5 hours per day and resulted in an average daily distance of over 54 miles per day at an average of over 12 miles per hour.
Having established the Technomics standard of technical excellence in which we are all steeped, Rick saw this as an ideal opportunity to collect an immense amount of data that could later be used to perform quantitative analysis of his and Hank’s riding performance, specifically either daily distance traveled or daily average speed.
He and three Technomics colleagues, two of whom do varying degrees of commuting to work on their bikes, collaborated in analyzing a wide variety of daily data that might explain Rick’s average speed. Not surprisingly, they applied the same types of techniques that the company and its talented analysts routinely use in helping our valued government clients understand and estimate the cost of complex defense, intelligence and civil agency programs. Specifically, they employed influence diagrams and a Technomics-developed Microsoft Excel Solver optimization tool to understand the impact of many potential explanatory variables on daily average speed.
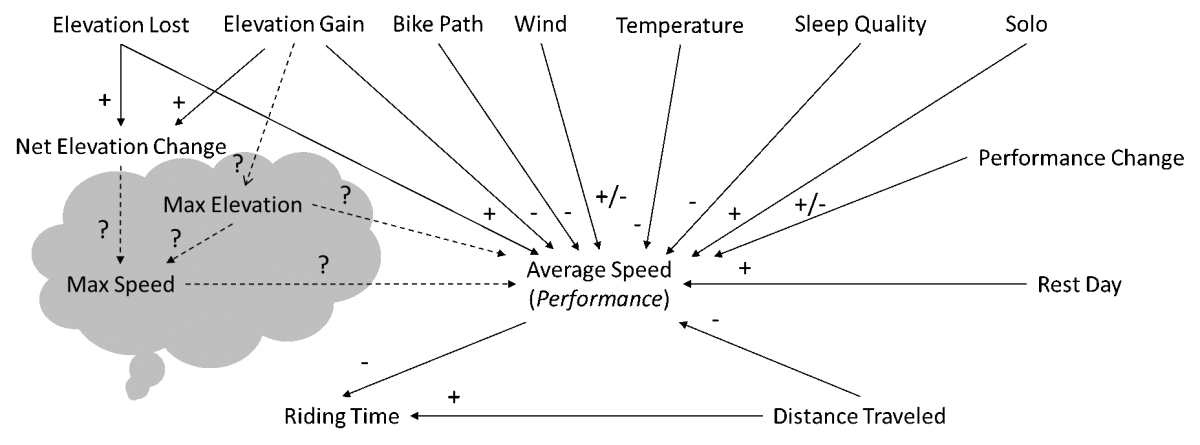
Influence diagramming is a powerful technique that originated in the 1950’s as a means to develop System Dynamics models that can be used to explain system behavior. Influence diagrams provide an efficient means to identify and depict potential relationships among variables that constitute a system.
The influence diagram below uses arrows and positive (+)/negative (-) signs to depict the hypothesized relationship between a variety of variables and average daily riding speed. A positive sign indicates a direct relationship (i.e., an increase leads to an increase or a decrease leads to a decrease). A negative sign indicates an inverse relationship (i.e., an increase leads to a decrease or a decrease leads to an increase). For example, as shown in the diagram below, Rick and his colleagues hypothesized that the further Rick rode in a day (Distance Traveled), the slower his average speed would be.
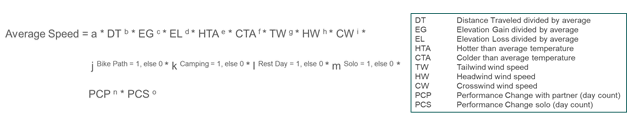
Similar to Technomics successful approach to developing parametric cost estimating relationships (CERs) for its clients, the team tested the hypothesized relationships depicted in the influence diagram using MS Solver. The structure of the specific optimization model that we used to quantify the influence of each explanatory variable and definitions of the variables are shown below.
Not surprisingly, the MS Solver results validated some and invalidated other hypothesized relationships depicted in the influence diagram. For example, Rick was convinced that a night of sleep in his own tent would put enough distance between him and loud snoring Hank to produce a more restful night leading to higher average riding speed the next day than a night of sleep in a bed that was two feet away from Hank’s bed. But the MS Solver results demonstrated otherwise.
 In closing, Rick and his colleagues’ work demonstrated the powerful combination of influence diagramming and constrained optimization. Additionally, their work served as a valuable reminder of the benefits of influence diagrams to understanding and communicating prospective relationships between variables. All cost analysts owe it to themselves and their clients to leverage influence diagrams in their work.
You can check out Hank and Rick’s blog here at rickandhanksbikeblog.wordpress.com and a paper authored by Rick and fellow-Technomicians, Orly Olbum, Maggie Dozier and Paul Hardin, for the 2018 International Cost Estimating and Analysis Association (ICEAA) Workshop here.


